 The recent McKinsey Quarterly Chart Focus was on the shift on the global economy's center of gravity. There has been a number of articles written on this subject but the interactive map from McKinsey Quarterly's website give a graphical interpretation as to the population centers and where economic power projection will becoming from.
Global cities will predominate and economics activities from these huge megalopolis will also mean several things: 1. Economies of scale in products and services, as transportation over long distance could be optimized 2. Any type of threats would be magnified as densely populated cities means that more people would be affected if there were any form of large-scale catastrophe 3. Governments need to sensitive to the demographics and population migration patterns, economic well-being of their citizens It would be interesting to watch and keep track of the trends and events that follow in the coming decades.
0 Comments
 This last week end was an extraordinary one. Why? Because there were two celestial events, one which had been forecasted some time ahead, but the other was quite, quite unexpected.
An asteroid with the size of about 50mwide (Asteroid 2012 DA-14) had flown past the Earth, and its path was even closer than that of some articificial satellites. If this asteroid had collided with the Earth, it could likely have triggered a catastrophic event that would have quite dire consequences. Fortunately, its orbital path did not include a collision course with the Earth this time, and it just passed us by uneventfully. The other event, on the other hand, was quite unexpected, principally because the flying object (a meteorite) was only about 17 m wide, quite dark to observe in the night sky and only burned up brightly when it entered the Earth's atmosphere over the Chelyabinsk region next to Kazakhstan. About a thousand and five hundred people were injured to some extent because the meteorite had created a shock wave (very high air pressure) during its descent and cause not a few windows to shatter, somewhat akin to a nuclear explosion about 20 to 30 km above. So what is my point? In business, we may be able to catch trends through observations and monitoring the markets, etc. However, sometimes, we may be caught unaware from seemingly small events which may seem innocuous and below our radar, but which may have a very significant effect after all. We should beware of small events that could snowball into something much larger, much more significant.  The upcoming issue of the Harvard Business Review (March 2013) will feature on on the future of advertising. Advertising is an aspect of Marketing which allows a product to be publicized. The general public needs to be made aware of the offerings of a company before sales can be generated; if there is no awareness, then how is the customer to know that something is available and being offered. One of the HBR blog video from this edition is entitled: "Why Some Ads Go Viral and Others Don't", where Prof.Thales Teixeira from the Harvard Business School, talks about some techniques that could be used in making memorable advertising videos. Another article I found fascinating is "How to Calculate the Value of a Like". The author, Dan Zarrella wote his formula of calculation of VOAL (Value Of A Like) as such: L/UpM x (LpD x 30) x (C/L) x CR x ACV = Value Of A Like where: L (Total Likes): The total number of audience members connected to your social media account. On Facebook, these are Likes of your page, and on Twitter, these are followers. UpM (Unlikes-per-Month): The average number of fans who "unlike" your social network account each month. On Facebook, this is an "unlike," and on Twitter, this is an "unfollow." LpD (Links-per-Day): The average number of times you're posting links, and potentially converting links driven from your social media account. On Facebook, this is the number of posts you're making, per day, that lead to a page on your website. On Twitter, this is the number of times, per day, you're Tweeting these kinds of links. C (Average Clicks): The average number of clicks on the links to your site you're posting on your social media accounts. CR (Conversion Rate): The average conversion rate of your website, from visit to sale or visit to lead. This can be an overall average, but for increased accuracy, use the conversion rate measured from traffic coming from the social network you're calculating. ACV (Average Conversion Value): The average value of each "conversion." In this context, a "conversion" is the action you've used to measure CR for. It could be average sale price or average lead value. For increased accuracy, use the average conversion value of traffic coming from the specific social network. Fascinating. I will have to try this formula some time, to see if the VOAL (Value Of A Like) is something which works for me. In fact, Dan also gave a link to a VOAL calculator. So, for you marketers out there, if you are interested, try this formula out 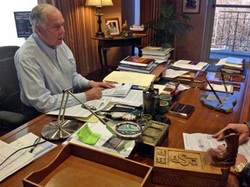 One of the things I often do when I visit a client's office is to size up the office decor and environment. This usually tells me something about the culture and perhaps even the values of the organization.
In a similar vein, it is instructive to see how the desk of the CEO of an organization look like, as it will give you an idea of the person. In this article from the Business Insider, we take a peek at the desks of some very successful people in the corporate world. I can attest to this because, I have personally come across the desk of the CEO of a certain local company which was a real mess (imagine piles of books, pieces of notes, scrolls of engineering drawings and who knows what else pile a foot high on the desk in one huge clutter). According to one of his staff, it was an 'organized mess' as the CEO was able to find whatever he wanted whenever he wanted from the pile on his desk, provided no one else disturbed the clutter. Well, to cut a long story short, a few months later, the local company got into a big legal mess when the structure they were building collapsed and they got fined by the regulators. It was only by good fortune that no one was hurt. So in essence the desk, or whatever the workspace that the CEO uses can tell a story about the organization's culture and values. |
About
|


The Minuteman
|


|
Some of my Professional Credentials:
 IRCA QMS
Lead Auditor
IRCA QMS
Lead Auditor
 Practicing Management Consultant

Associate Member Singapore Human Resource Institute

Advanced Certificate in Training and Assessment (WDA-certified)

Certified IT Business Continuity Manager (CITBCM)

Associate Member, Singapore Institute of Directors
Archives
December 2015
April 2015
March 2014
February 2014
January 2014
December 2013
July 2013
June 2013
May 2013
April 2013
March 2013
February 2013
January 2013
December 2012